


The design of the experiments conducted in this study, along with the subsequent analysis and discussion of the results, is structured to demonstrate that integrating code metrics and process metrics using a deep CNN yields superior mobile App defect prediction compared to using either metric type in isolation. As shown in Table 5 and Fig. 5, the experimental design proceeds in three stages to evaluate the contribution of each metric type.
In the first phase, only code metrics such as LOC and CBO extracted from the mobile app are used to train and evaluate the model. Table 5 presents the average performance indicators at this stage, with F1 scores of 0.531, AUC of 0.671, MCC of 0.378, and PofB20 of 0.346.
In the second phase, the model is trained and evaluated using only process metrics derived from historical code changes, such as LD and LA. The performance was similar or slightly lower than code metrics alone, with averages marginally differing: F1 scores 0.534, AUC 0.661, MCC 0.383, and PofB20 0.352.
In the final phase, both static code and process metrics are integrated into the model using deep CNNs to capture complex interactions and complementary information. This fusion enhances mobile App defect prediction performance significantly over individual sets. As shown in Table 5 and Fig. 5, the average F1 score rises to 0.566, AUC to 0.707, MCC to 0.422, and PofB20 to 0.391, which confirms that the complementary information provided by both metric sets leads to more accurate defect prediction.
Figure 5 also presents a visual representation of these improvements, showing that performance is enhanced in both metric types. This approach makes the DMLM model benefit significantly from a mixture of characteristics to improve the defect prediction performance in mobile apps.


F1 scores, AUC, MCC, and PofB20 scores of DMLM for code metrics, process metrics, and both metrics.
The evaluation process of the proposed DMLM, compared with state-of-the-art methods, is structured around addressing the research questions outlined in Section 5.1. The predictive performance of the proposed DMLM model is assessed through a comparative analysis against six state-of-the-art methods: ML, DNN, CDFE, KAL, SDF, and MTL-DNN. The evaluation is conducted under non-effort-aware conditions using F1 score, AUC, and MCC, and under effort-aware conditions using PofB20.
To address RQ1, a comprehensive performance comparison is conducted between the proposed DMLM model and six baseline methods. Table 6 illustrates the evaluation results based on F1 scores, highlighting the predictive effectiveness of each approach. Similarly, Table 7 presents the comparative analysis regarding AUC, providing insights into the models’ ability to distinguish between defective and non-defective instances. Additionally, Table 8 showcases the performance assessment using MCC, further demonstrating the reliability and robustness of the proposed model compared to existing techniques. These experimental findings indicate that the DMLM approach outperforms other baseline approaches in the context of non-effort-aware mobile app defect prediction. Specifically, DMLM exhibited superior performance across multiple evaluation metrics, including F1 scores, AUC, and MCC. The average F1 scores achieved by DMLM stood at 0.566, surpassing the corresponding scores of all baseline methods. The average AUC score for DMLM was notably higher at 0.707 compared to the AUC scores of the baseline methods. Moreover, the average MCC scores of DMLM reached 0.422, consistently outperforming the MCC scores associated with the baseline methods. These results show that fusing code and process metrics can enhance a mobile app defect prediction under non-effort aware scenarios.
Figures 6, 7, and 8 provide a visual comparison of the performance distribution of the proposed DMLM model against six baseline methods (ML, DNN, CDFE, KAL, SDF, and MTL-DNN) across all seven experiments. Specifically, Fig. 6 illustrates the boxplots of F1 scores for each approach based on the results from Table6, while Fig. 7 presents the AUC boxplots corresponding to the evaluations in Table7. Likewise, Fig. 8 depicts the MCC boxplots derived from Table8. Each boxplot represents the distribution of F1 scores, AUC, and MCC across the experiments, capturing key statistical measures such as the median, upper, and lower quartiles for all evaluated models. The visual analysis demonstrates that the DMLM model consistently performs better than the six baseline methods in terms of F1 scores, AUC, and MCC across most tasks. Overall, the results confirm that the proposed DMLM model outperforms existing state-of-the-art approaches in mobile app defect prediction under non-effort-aware conditions. These findings highlight the effectiveness and robustness of DMLM in capturing critical defect-related patterns and improving predictive accuracy in mobile App.


Comparison of F1 scores for ML, DNN, CDFE, KAL, SDF, MTL-DNN, and DMLM under within projects.

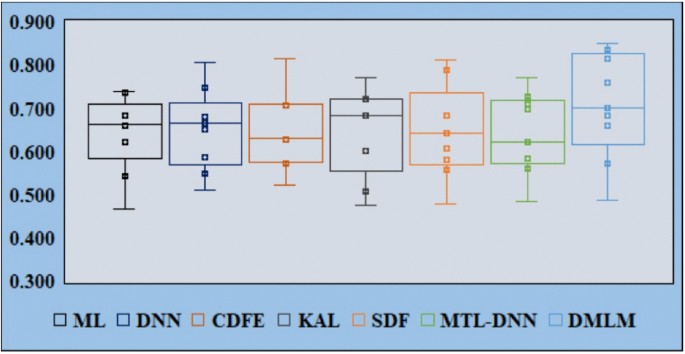
Comparison of AUC scores for ML, DNN, CDFE, KAL, SDF, MTL-DNN, and DMLM under within projects.

Comparison of MCC scores for ML, DNN, CDFE, KAL, SDF, MTL-DNN, and DMLM under within projects.
In addition, the evaluation and comparative process is extended to cross-project scenarios, where the prediction model is first trained using sufficient existing training data on one project containing defect labels. Then, this trained model will predict the defects of another new project with insufficient labeled data. As shown in Table 9 DMLM achieved the highest average F1 score of 0.465, superior to all baseline approaches. This illustrates that DMLM effectively transfers learned patterns across different projects. Table 10 shows that the average AUC for DMLM was 0.574, indicating an outperforming defect prediction performance compared to baseline methods, which scored below 0.52 on average. DMLM also achieved the highest MCC (0.362) as presented in Table 11, demonstrating efficiency and consistent predictions even in cross-project contexts.
The boxplots presented in Figs. 9, 10, 11 demonstrate that DMLM not only achieves a higher median performance but also exhibits a more stable and consistent distribution of scores across various project pairs compared to the baseline methods. These findings suggest that DMLM’s fused feature representation effectively captures transferable patterns of defect proneness relevant to different mobile application domains. These findings confirm that DMLM generalizes well beyond the training project, making it a practical tool for predicting defects in projects that have minimal historical defect data.


Comparison of F1 scores for ML, DNN, CDFE, KAL, SDF, MTL-DNN, and DMLM under cross projects.


Comparison of AUC scores for ML, DNN, CDFE, KAL, SDF, MTL-DNN, and DMLM under cross projects.


Comparison of MCC scores for ML, DNN, CDFE, KAL, SDF, MTL-DNN, and DMLM under cross projects.
For RQ2, the effort-aware evaluation aims to rank the probability density of defects based on the predicted probability value and the LOC. To conduct this evaluation, all experiments are performed, and the PofB20 of each experiment is calculated according to the setup details outlined in Section 5.4. The performances of the proposed DMLM model and other baseline methods are then compared using PofB20 under effort-aware conditions. Table 12 displays the performance of the proposed DMLM model against these six baseline methods in terms of PofB20. The results showed the superior performance of the DMLM approach in effort-aware mobile app defect prediction. Specifically, DMLM exhibited notable effectiveness in the PofB20 measure, surpassing the capabilities of state-of-the-art baseline methods. DMLM achieved a PofB20 score of 0.391, clearly outperforming the corresponding scores of all the baseline methods considered in the study. These results underscore the efficacy of the DMLM approach in enhancing the accuracy of mobile app defect prediction in scenarios where the consideration of development effort is paramount. In addition, Fig. 12 provides a comparative analysis of the PofB20 metric for the proposed DMLM model and six baseline methods (ML, DNN, CDFE, KAL, SDF, and MTL-DNN) across seven experimental settings, as detailed in Table 12. The boxplots illustrate the distribution of PofB20 values, capturing key statistical indicators such as the median, upper quartile, and lower quartile for each approach. The visual representation in Fig. 12 highlights the superior performance of DMLM compared to the baseline methods in nearly all experimental cases. The consistently higher PofB20 values achieved by DMLM demonstrate its effectiveness in identifying defective components while considering testing effort constraints. Overall, the results confirm that the proposed DMLM model outperforms existing state-of-the-art approaches in effort-aware mobile app defect prediction. These outcomes underscore the model’s capability to optimize defect detection while efficiently allocating testing resources, making it a more reliable solution for practical software quality assurance.

Comparison of PofB20 scores for ML, DNN, CDFE, KAL, SDF, MTL-DNN, and DMLM under within projects.
In addition, the evaluation and comparative process is extended in the cross-project assessment under effort-aware conditions, using the PofB20 metric, which further solidifies the practical value of DMLM. As shown in Table 13, DMLM achieves the highest average PofB20 score of 0.347, indicating that it helps developers to identify the most defects by inspecting only 20% of the code in a new, unseen project. This performance outperforms all baseline methods. Figure 13 demonstrates the superiority of DMLM, as it shows that the PofB20 values for DMLM are consistently higher across different project transfer pairs. This finding is significant because it confirms that DMLM can effectively prioritize inspection efforts even when used on a new project with training data from another project. These findings demonstrate that the proposed approach is a valuable tool for development environments with limited resources.


Comparison of PofB20 scores for ML, DNN, CDFE, KAL, SDF, MTL-DNN, and DMLM under cross projects.
For RQ3, we employ the Wilcoxon Signed Rank Test (WSRT) and Cliff’s delta to determine whether the performance differences between the proposed DMLM model and the baseline models are statistically significant. The WSRT is a non-parametric test that does not assume a specific data distribution and is commonly used to compare two paired samples. If the resulting p-value is less than 0.05, it indicates a statistically significant difference; otherwise, it is considered insignificant.
To mitigate potential biases from multiple comparisons in this study, we incorporate the Win/Tie/Loss metric to assess model performance comprehensively. Furthermore, Cliff’s delta (\(|\delta |\)) is utilized to measure the practical significance of the observed differences between datasets, offering more profound insights into the comparative effectiveness of the models. The interpretation of absolute Cliff’s delta values about practical significance levels is summarized in Table 14.
Table 15 presents the Win/Tie/Loss analysis results based on F1 scores, providing a comparative evaluation of the models. Each column in the table includes the p-values obtained from the Wilcoxon Signed Rank Test (WSRT) and the corresponding Cliff’s delta values. The original value is retained if the WSRT p-value is greater than or equal to 0.05. Conversely, if the p-value falls below 0.05, it is represented as “<” to indicate statistical significance. Additionally, the practical importance of Cliff’s delta values is assessed based on the predefined thresholds in Table 14. The sign of the delta value (“\(+\)” or “−”) is used to denote whether the observed effect favors the proposed model or the baseline methods, providing further insights into the relative strengths of each approach. For example, when comparing the DMLM method with the ML approach on the “TV” project, the Cliff’s delta value is greater than 0.474, and the p-value is less than 0.05. Consequently, the entry for “DMLM vs. ML” is recorded as “\(+L(<0.05)\)”. Following the Win/Tie/Loss measure criteria, the DMLM model is classified as a “Win.”
Additionally, Table 16 presents the Win/Tie/Loss analysis results based on AUC values, while Table 17 provides the corresponding evaluation for the MCC metric, and Table 18 reports the results for POFB20. A comprehensive examination of the WSRT p-values, Cliff’s delta values, and the “Win/Tie/Loss” outcomes across Tables 15 to 18 reveals a consistent trend– the proposed DMLM model demonstrates superior performance compared to the baseline approaches across multiple evaluation metrics. These results further validate the robustness and effectiveness of the DMLM model in handling diverse predictive tasks. This holds in both effort-aware and non-effort-aware conditions, further validating the superior performance of DMLM across multiple evaluation metrics.
link